MTF Measurement Software SFR-Fit
Software for measuring the spatial frequency response (SFR) of cameras


- Home
- Product Info
- Image and Industry Related
- SFR-Fit MTF Measurement Software
- General
- Material/Explanatory video
- Download
SFR-Fit is software for measuring the MTF (Modulation Transfer Function), which indicates the spatial frequency characteristics of a camera. MTF expresses how faithfully the contrast of the subject being imaged can be reproduced, and is the most important measurement item in evaluating camera performance. Until now, the most commonly used methods for measuring MTF were the slanted edge method based on ISO12233 and the sine wave contrast method using a Siemens star chart. SFR-Fit is a completely new MTF measurement method that uses a unique algorithm to handle images with large distortions, which have been difficult to measure in the past, and image processing such as sharpness and compression. It is ideal for evaluating cameras used in fields such as automobiles, surveillance, and medicine.
Features
-
Resistant to noise and image processing
One problem with the slanted edge method, which is generally used to measure MTF, is that the measured values in the high-frequency region are unstable when there is significant image noise. Also, when image processing such as sharpness and compression is applied, the linearity of the MTF calculation, which is the basis of the slanted edge method, is not satisfied, and the validity of the measured value may be lost. SFR-Fit adopts the sinusoidal contrast method and measures the contrast by the least-squares method. With this method, even if the captured image contains noise or harmonic components due to image processing, the fundamental component can be extracted and measured producing stable results that are not affected by noise or image processing. -
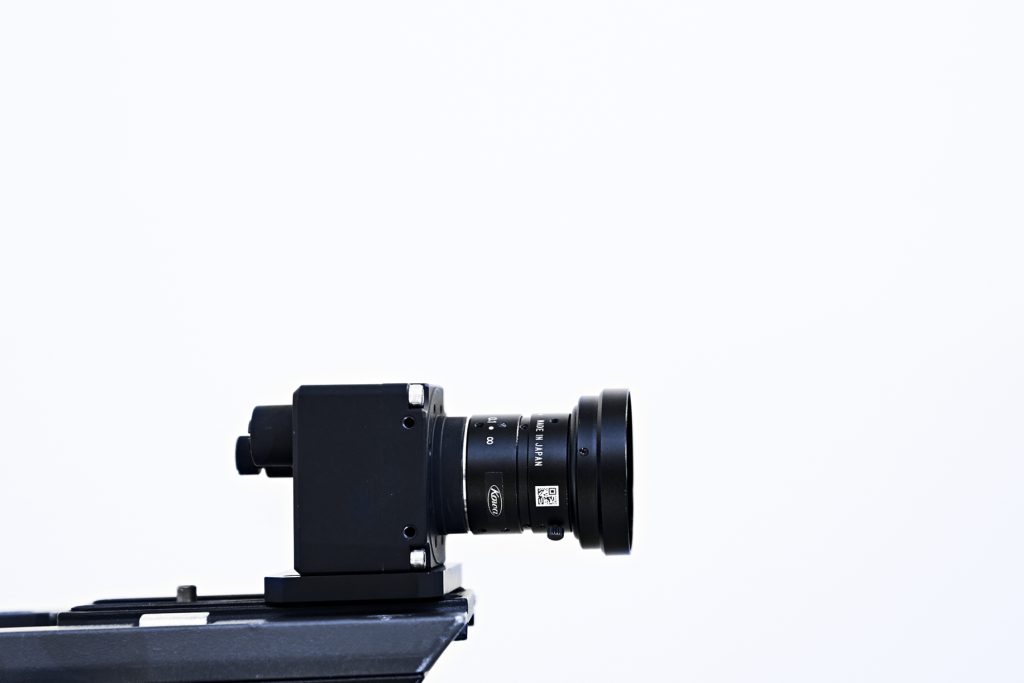
Compatible with fisheye and ultra-wide-angle cameras
The sine wave contrast method was generally measured using a Siemens star chart, but this measurement method was not compatible with images with large distortions such as those obtained with an ultra-wide-angle camera using a fisheye lens. SFR-Fit solves the problem of the sine wave contrast method using the Siemens star chart by analyzing the distortion of the image and then measuring the MTF on the undistorted test pattern. This function enables MTF measurement that is resistant to noise and image processing and also accommodates distortion. In addition, since the process from image distortion analysis to measurement is automatically executed, it contributes to labor saving in inspection work.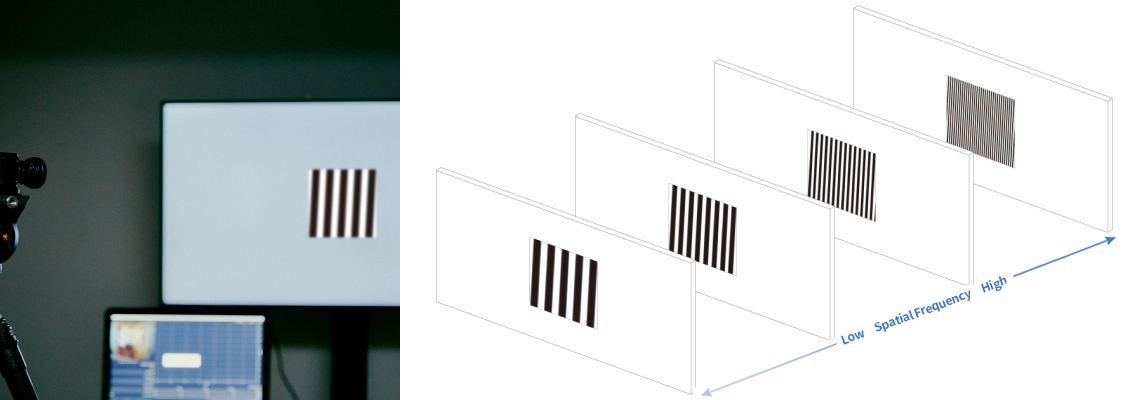
-
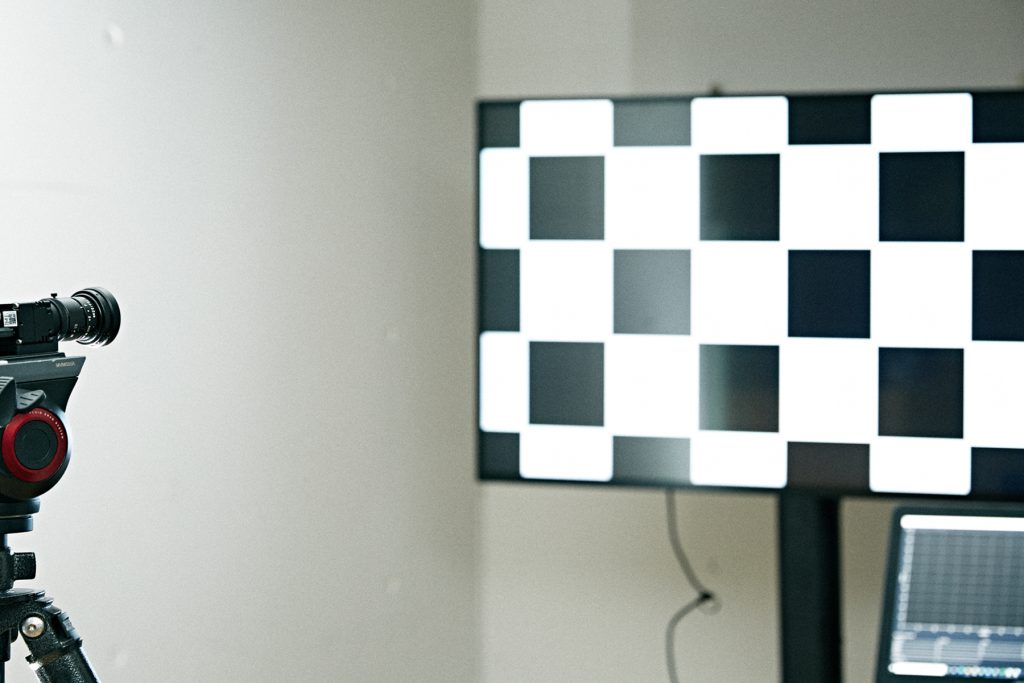
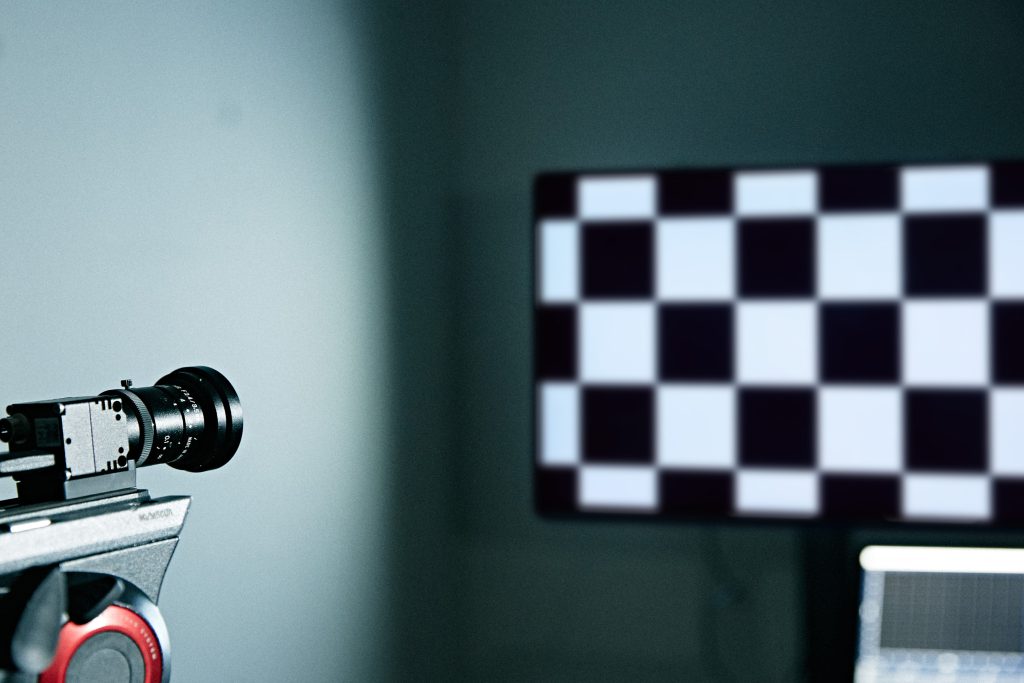
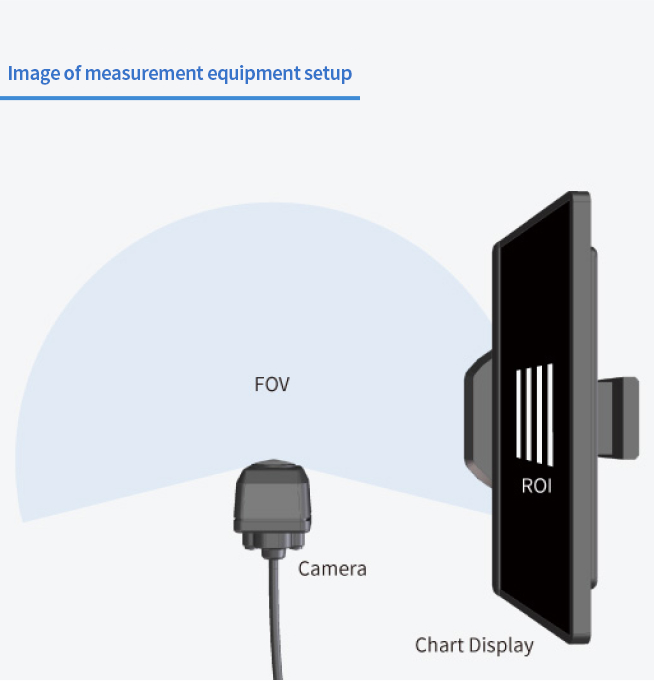
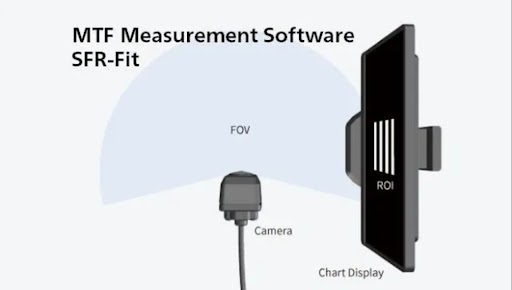
Free placement of test charts
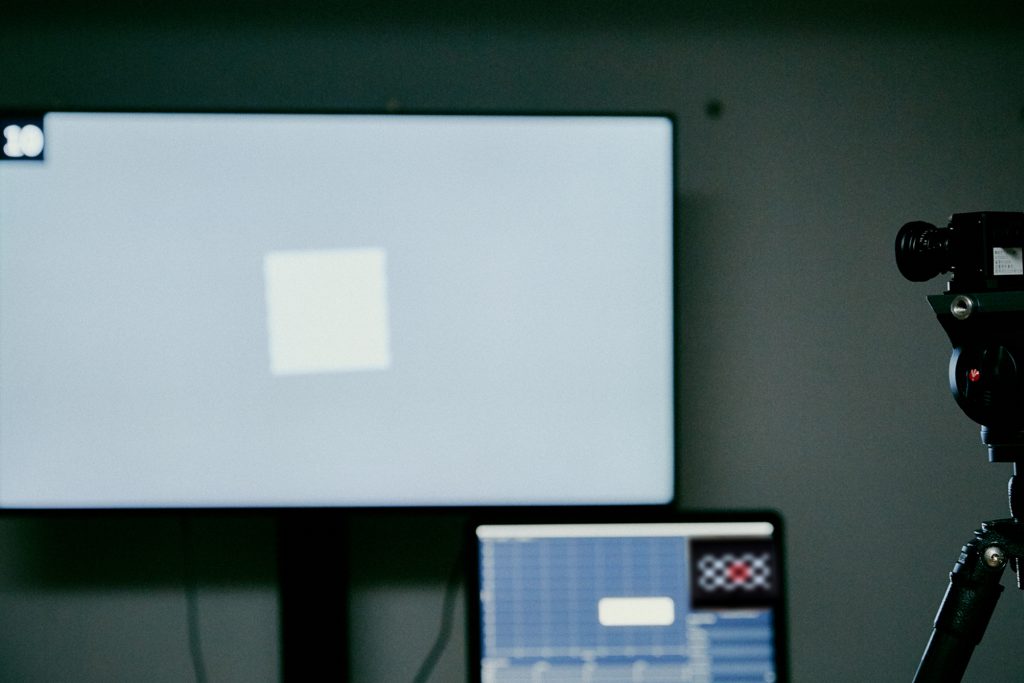
SFR-Fit uses a display as a test chart to measure the MTF with a test pattern aligned with the camera and test chart positions. The optimum test pattern is generated on a display placed in the desired test location, and accurate MTF is then measured. This allows for simple measurement of the periphery of an ultra-wide-angle camera. *1*1
*1 Exact placement has conditions. For details, please refer to the instruction manual.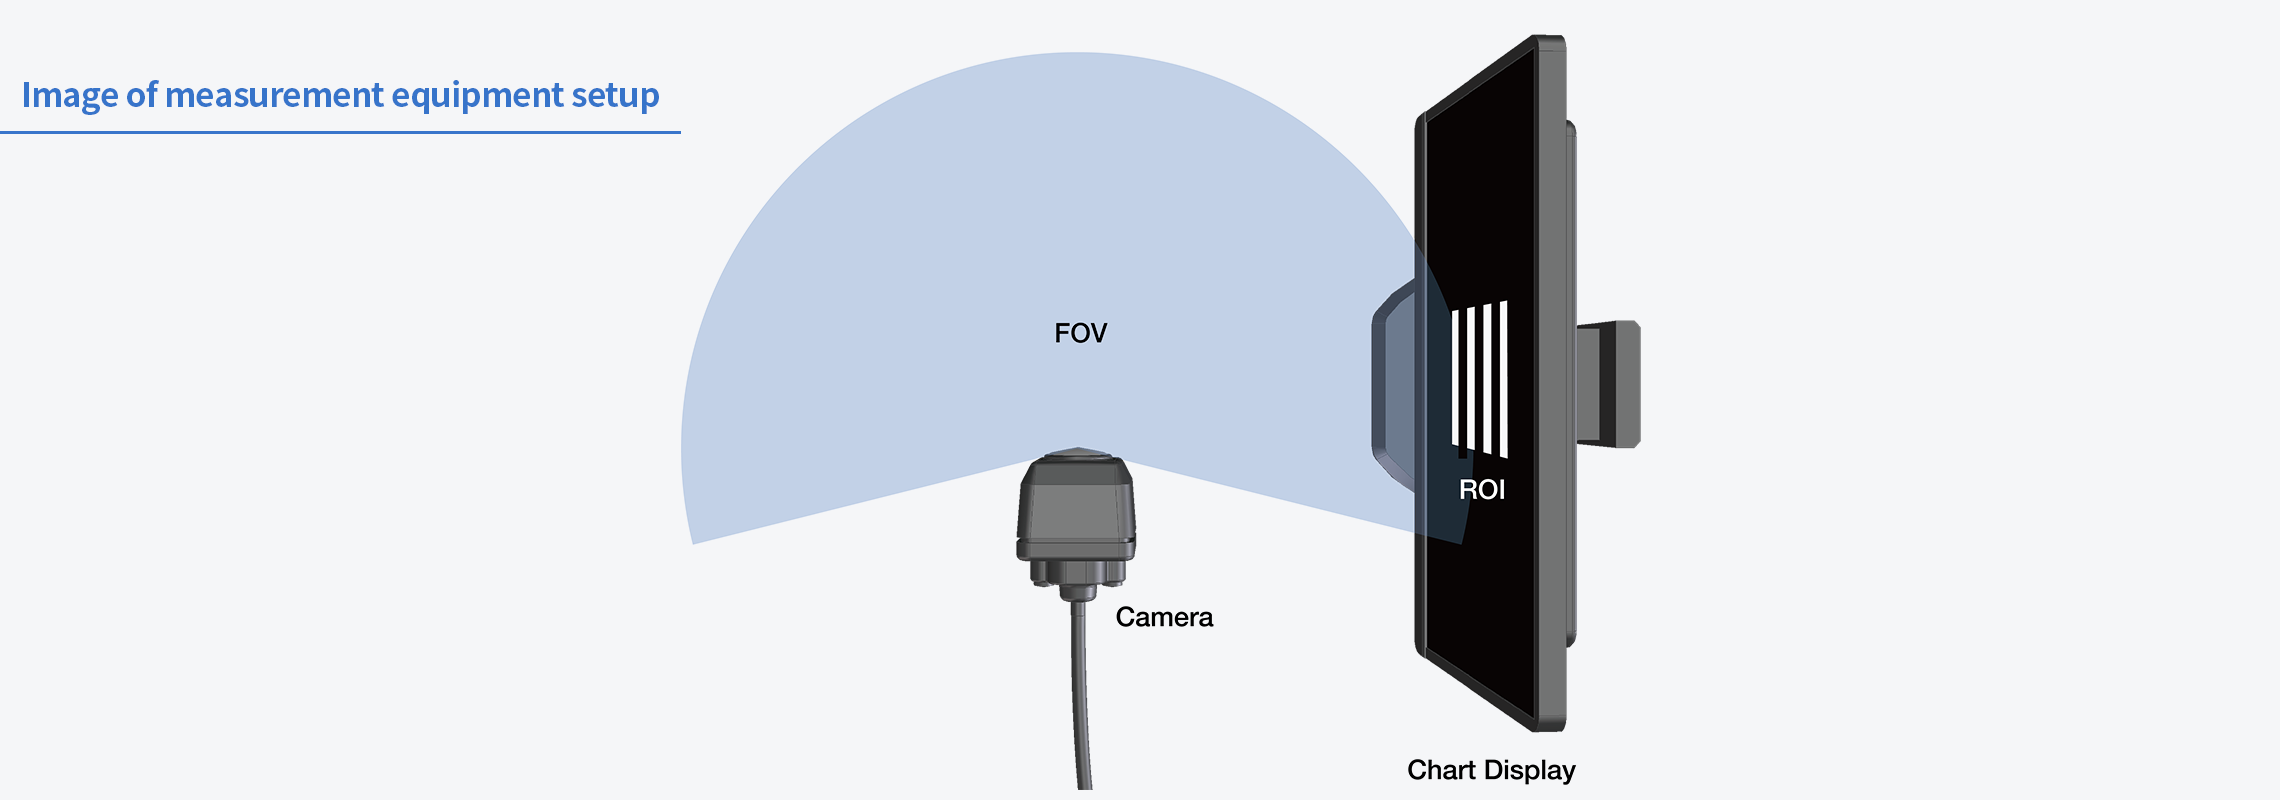
-
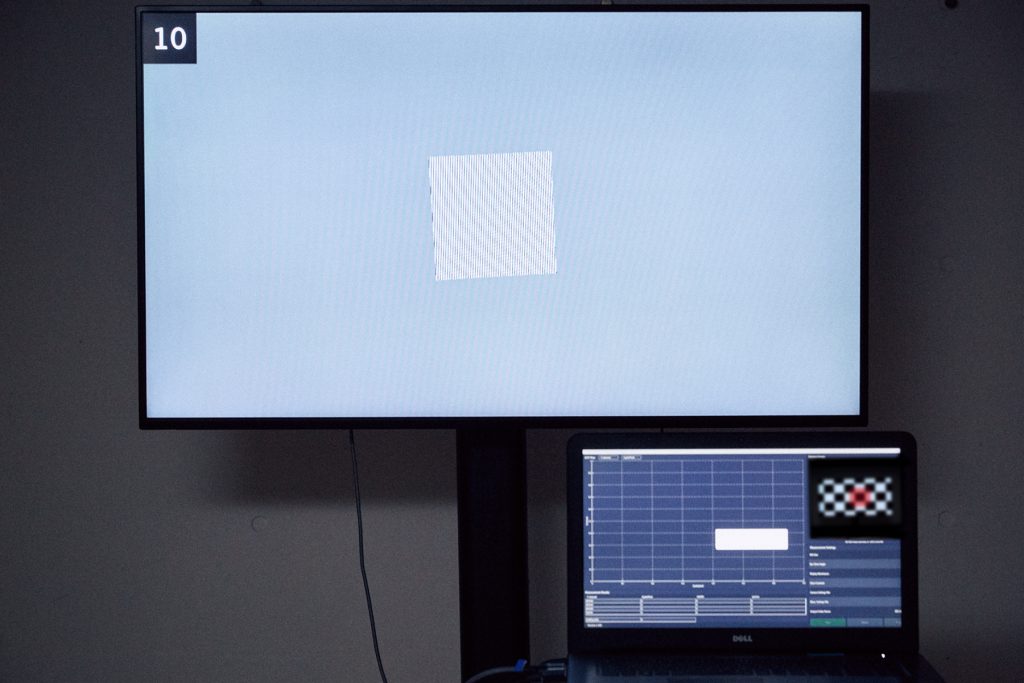
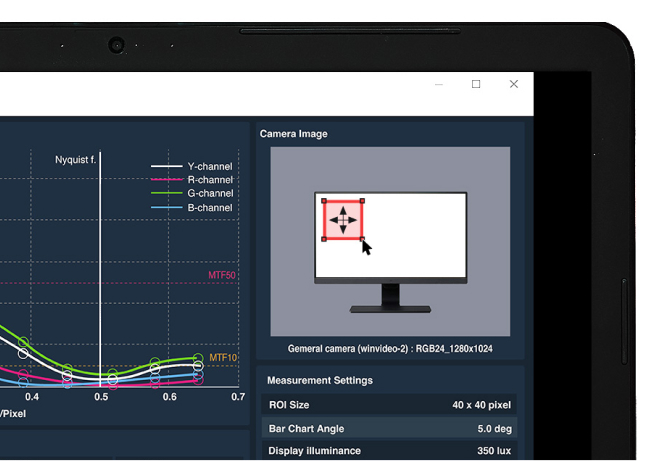
Can measure localized MTF in a region of interest (ROI)
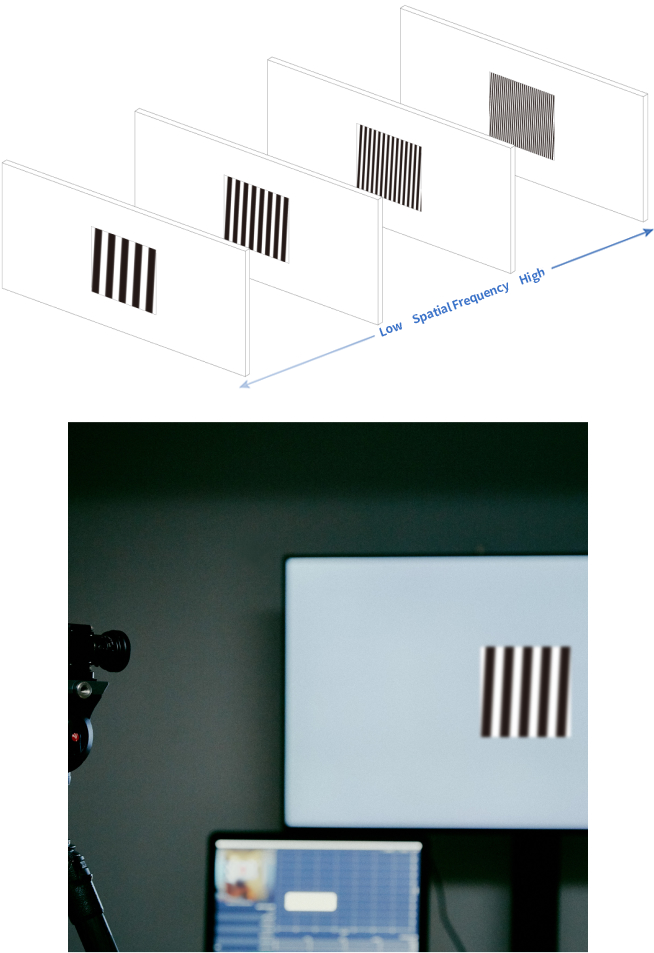
Since the test pattern is switched for each spatial frequency, the measurement area (ROI) is miniaturized and partial MTF can be measured. For example, you can arbitrarily set the measurement points such as the center of the image and the image height of 40% or 80%. The measurement area can be easily set by clicking and dragging with a mouse or entering numerical values.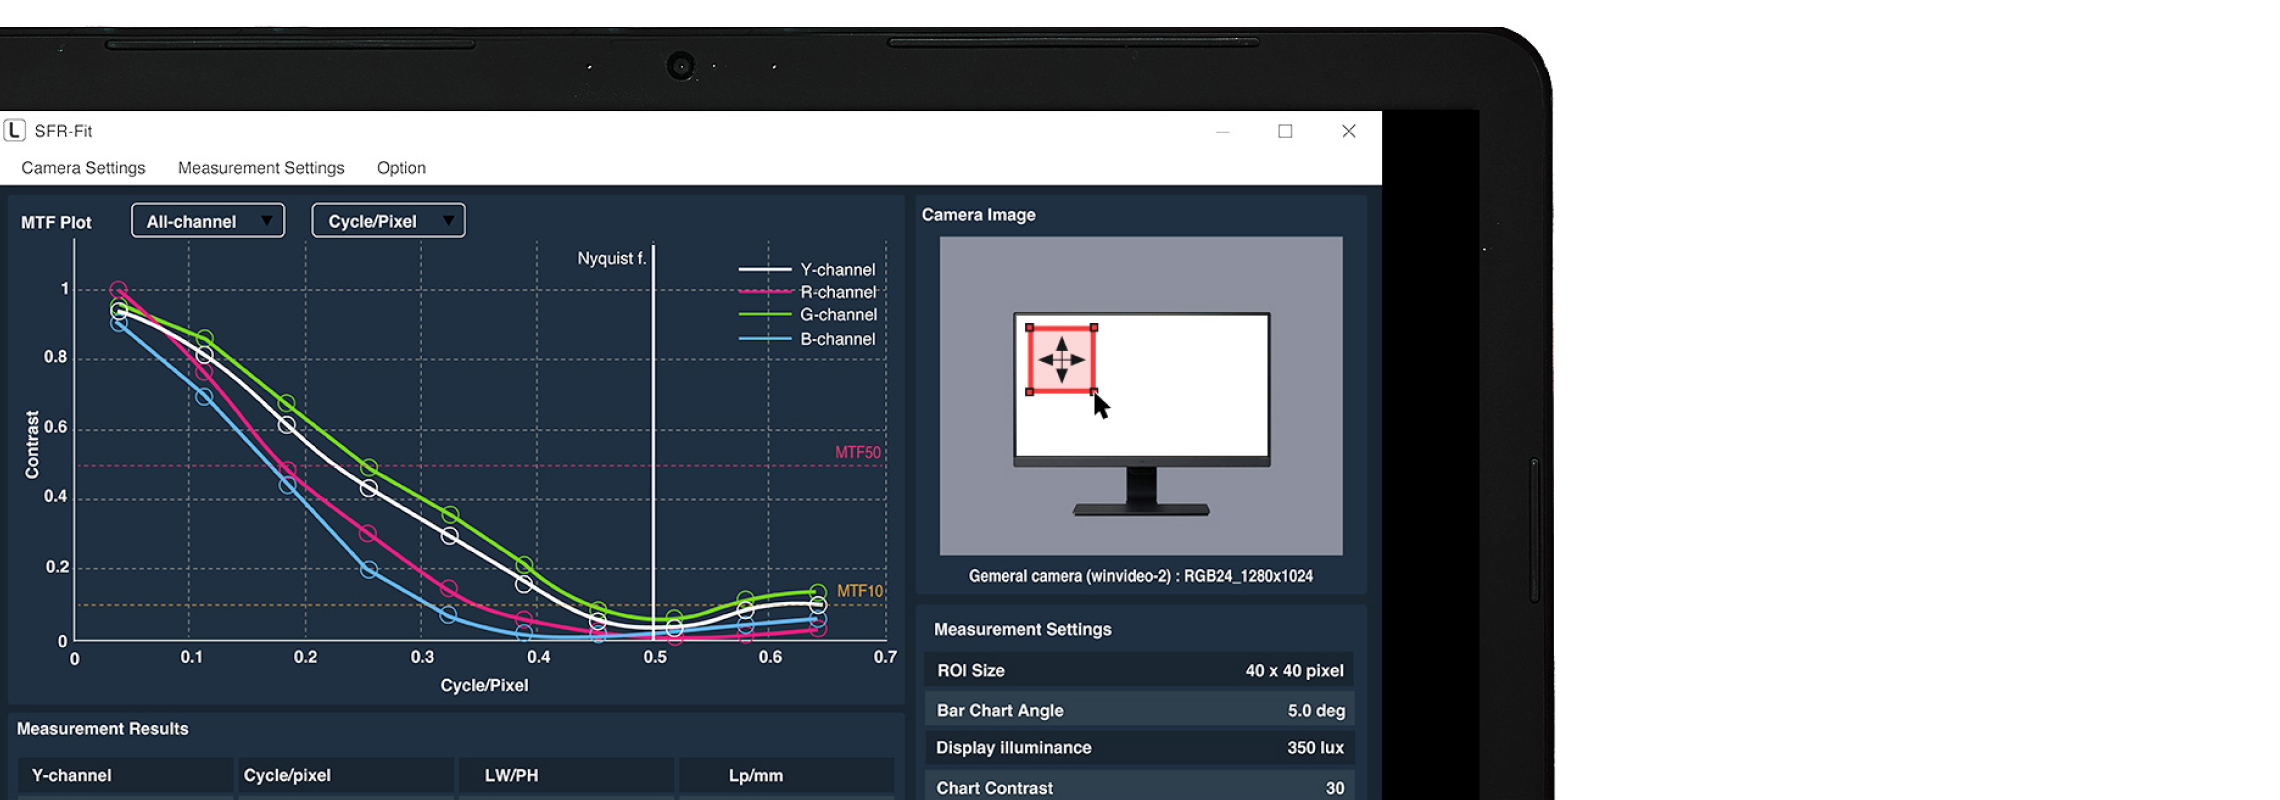
-
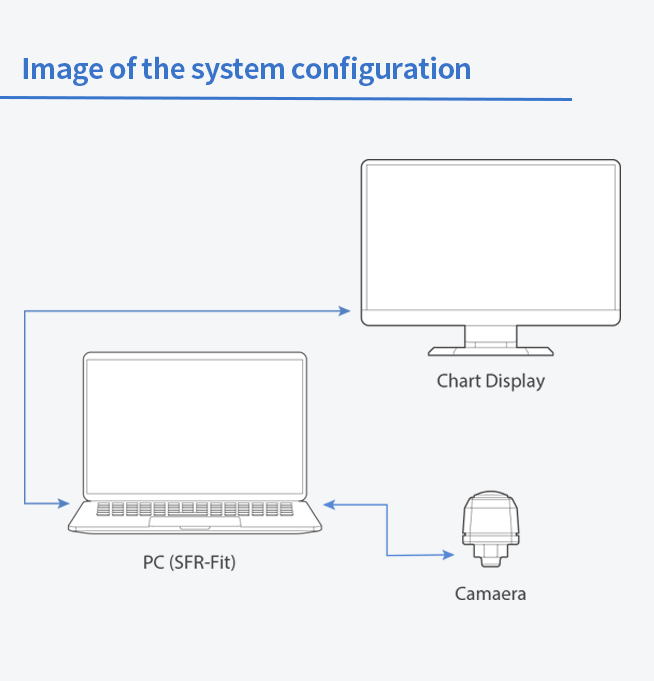
Simple system configuration
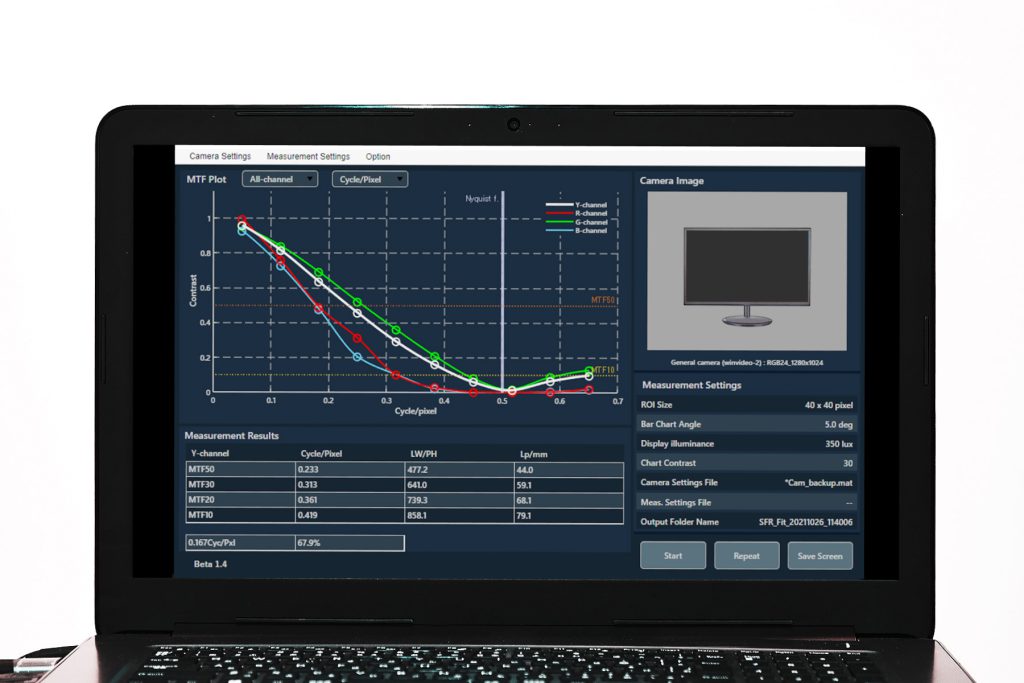
The equipment required for measurement is only a PC with SFR-Fit installed and a display used as a test chart. After connecting the camera to be inspected and completing the software settings, simply press the start button and the MTF measurement results will be displayed. MTF plot data and MTF values will be saved as a CSV format file. It is also possible to save images and test patterns during measurement.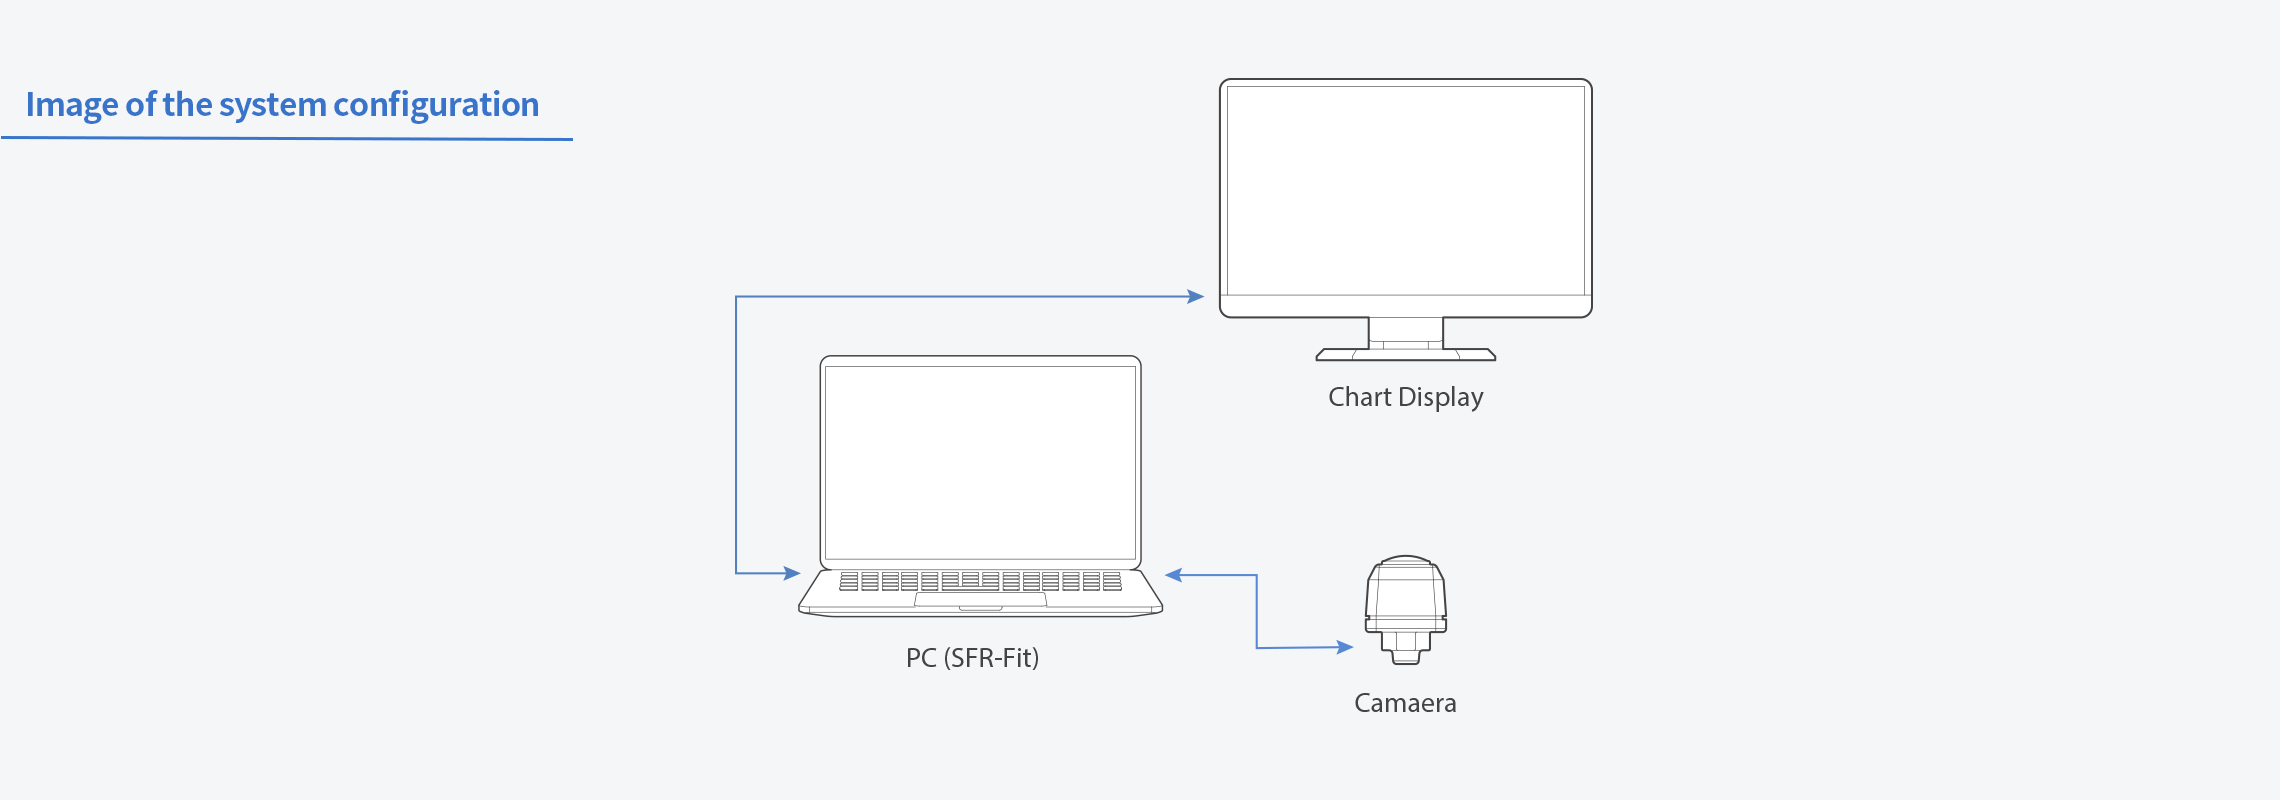
Function
-
Display channel selection function
Measurement results can be displayed for each luminance and R.G.B channel. It is possible to display all components at the same time as well as independent display for each component.
-
Graph unit selection function
There are three selectable result units: line pair per millimeter (LP/mm), cycle per pixel (cycle/pixel), and line width per picture height (LW/PH). Line Pairs Per Millimeter indicates the number of black and white line pairs displayed per millimeter. Cycles per pixel is the unit of spatial frequency normalized by the pixel pitch of the image sensor, indicating the number of cycles of the pattern displayed per pixel. For example, if a sine wave pattern is drawn with 10 horizontal pixels, there is 0.1 cycle per pixel, so 0.1 cycle per pixel. Since at least 2 pixels are required to represent one cycle, the highest frequency is 0.5 cycles per pixel. Per Picture Height indicates the number of scans per image height. -
Selectable Data Points
You can display the measured values in the graph of the measurement results. Just click anywhere on the graph to display the measured value, so you can easily read the MTF value. In addition, since it is possible to display multiple points at the same time, the measurement value of each point can be checked instantaneously.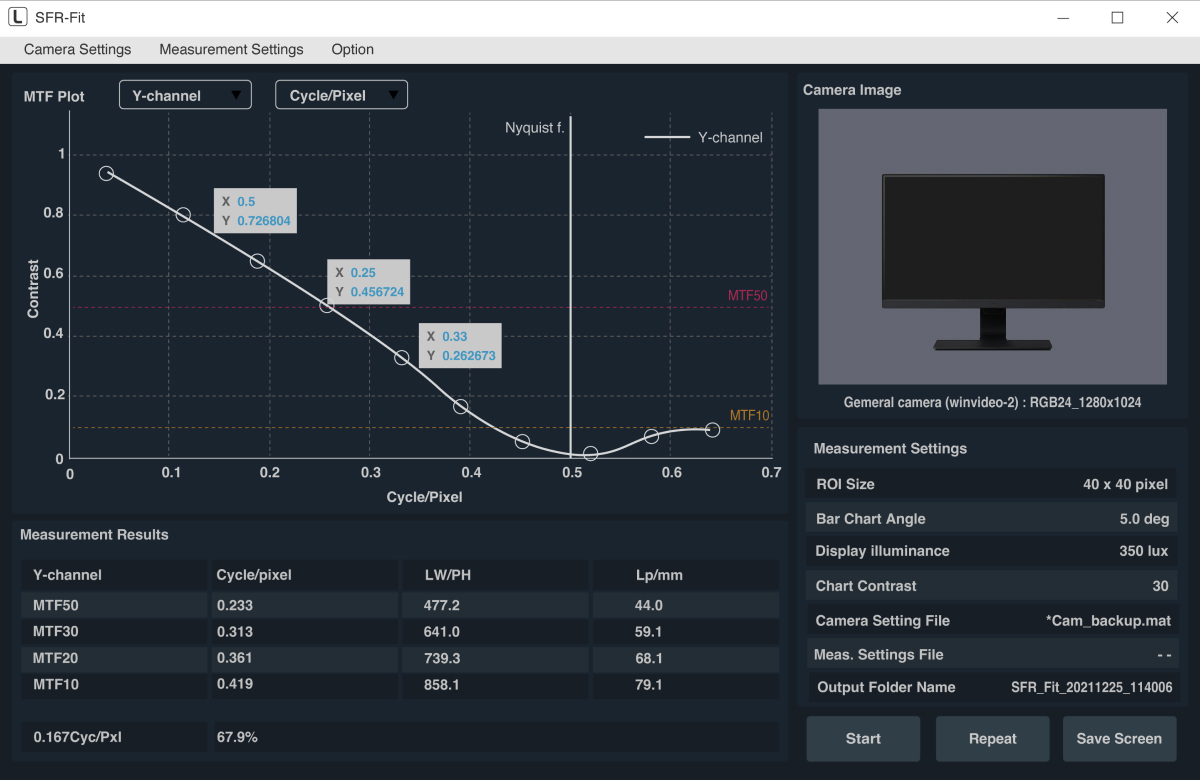
-
Bar chart sampling waveform display
It is possible to display sampling waveforms for each spatial frequency, brightness, and R.G.B channel of the generated bar chart. The horizontal axis of the graph is the sampling point (resolution varies with spatial frequency). The vertical axis is the luminance level after linearization. The sampling waveform display of SFR-Fit corresponds to the edge profile of the slanted edge method, and can be used, for example, to check the influence of image processing, the occurrence of aliasing, and the saturation of luminance.
CES2023 Leader Electronics Corporation Exhibit Report
Introduction Video
- Introducing the SFR-Fit
Login to My Leader is required to download some technical information.
If you have my Leader account, please login from below, if you do not have an account, please create an account and login to my Leader.